Understanding the Excel Interface
Excel's interface is designed to be user-friendly, but it can seem overwhelming at first. Let's break it down into its core components:
Basic Components
- Workbook: The main file containing one or more worksheets.
- Worksheet: A sheet within a workbook where you input and analyze data.
- Cell: The intersection of a row and column where data is entered.
- Row: A horizontal line of cells identified by numbers (1, 2, 3, etc.).
- Column: A vertical line of cells identified by letters (A, B, C, etc.).
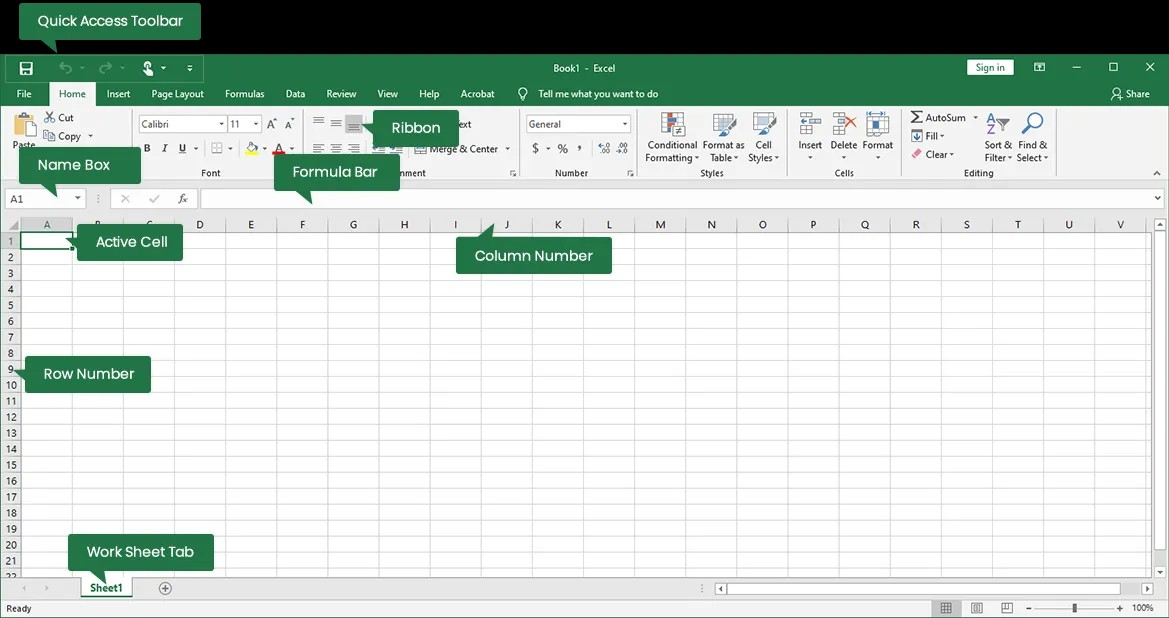
Interface Elements
- Title Bar: Displays the workbook name and Excel application name.
- Quick Access Toolbar: Customizable toolbar for frequently used commands.
- Ribbon: Contains tabs (Home, Insert, Page Layout, etc.) with groups of commands.
- Name Box: Shows the address of the active cell.
- Formula Bar: Displays the contents of the active cell (data or formula).
- Worksheet Tabs: Allow you to switch between different worksheets.
- Scroll Bars: Used to navigate through the worksheet.
- Status Bar: Shows information about the worksheet, such as number of selected cells.
Key Areas of the Ribbon
- Home: Basic formatting, editing, and cell alignment.
- Insert: Add tables, charts, pictures, shapes, and more.
- Page Layout: Control page margins, orientation, themes, and scaling.
- Formulas: Insert functions, names, and perform calculations.
- Data: Sort, filter, analyze data, and create data connections.
- Review: Proofing, comments, protection, and changes tracking.
- View: Customize worksheet appearance, zoom, and display options.
Navigating and Using Excel
- Selecting Cells: Click on a cell to make it active. Drag to select a range of cells.
- Entering Data: Type data directly into the active cell or formula bar.
- Using Formulas: Start with an equal sign (=), then enter functions or cell references.
- Formatting: Apply fonts, colors, number formats, and cell styles.
- Creating Charts: Visualize data with various chart types.
- Sorting and Filtering: Organize data based on specific criteria.
Would you like to delve deeper into a specific area of the Excel interface or learn how to perform a particular task?
I can provide more detailed explanations, examples, and step-by-step instructions.
Here are some possible topics:
- Basic data entry and formatting
- Creating and using formulas
- Creating charts
- Data analysis tools
- Excel shortcuts